
Asset class allocations and returns of large European institutional investors
Author: Alexander D. Beath, CEM Benchmarking
Date: June 8, 2023
The main drivers of institutional investor portfolio returns are three-fold. Allocations - where are investors putting their money. Returns - what do investors get for the allocation decisions they make. Costs - how much does it cost to implement an investors allocation.
At CEM Benchmarking we have been collecting data on these three drivers from the worlds’ largest institutional investors for over 30 years. Five years ago EPRA sponsored a publication that gave a detailed look into the allocations, performance, and costs of large institutional investors across Europe. An update of the study is to be released late summer 2023. What are the key takeaways?
In terms of allocations, European institutional investors allocate most of their assets to the bedrocks of most portfolios, equity and fixed income, primarily via liquid, low cost, listed-market channels. This serves to maintain liquidity and to keep costs low (see Exhibit 1).
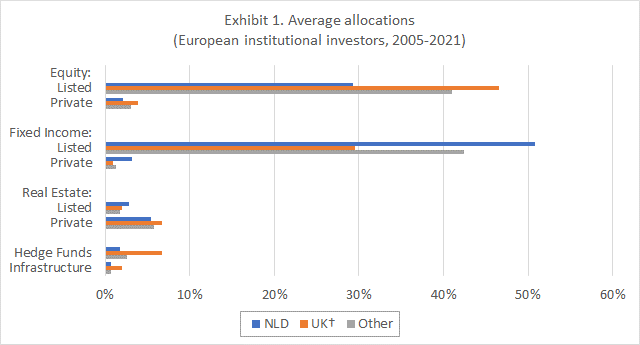
Allocations to (potentially) higher risk-return implementations of equity and fixed income however are growing via illiquid, private-market unlisted channels, but the balance between more listed / less private is in no danger of being flipped.
The primary diversifier in European institutional investor portfolios is real estate, with average allocations typically 8-9% of total assets. The balance between listed and private implementation of real estate however is reversed in comparison to equity and fixed income. Where the ratio of listed to private equity is typically of the order 10:1 (greater than 20:1 for fixed income), for listed and private real estate the relative magnitudes are reversed at roughly 1:3.
In the case of equity, the rationale for building portfolios using listed channels augmented by private channels cannot be made purely based on historically realized returns; private equity outperformed listed equity by approximately 2-4% (see Exhibit 2). In terms of risk adjusted returns the comparison is more ambiguous, with listed and private equity producing similar Sharpe ratios. The preference for listed equity over private equity is instead due to the low cost of investing but also qualitative factors such liquidity maintenance and valuation transparency.
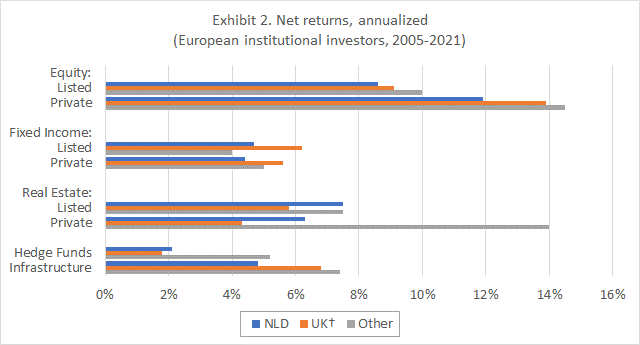
By contrast, in the case of real estate the rationale for building portfolios using listed channels would seem to be clear – generally superior returns, similar levels of risk, higher risk adjusted returns, and even on a leverage adjusted basis, superior net value added in most markets[1].
What to make of the different implementation choices between equity and fixed income on one hand and real estate on the other? Two reasons; first is the widespread belief that private real estate is less volatile than listed real estate, and second the misconception that private real estate is uncorrelated to other asset classes. Both reasons are unfortunately based on a common misunderstanding of how private market performance is reported, where returns are based on appraisals rather than marked-to-market returns as in listed markets.
Adjusting returns to remove appraisal smoothing and lag from reported private market returns enables unbiased comparisons of returns across listed and private implementation models, at least in private equity, real estate, and infrastructure‡. What this reveals is remarkable. Where reported volatilities of private real estate are half that of listed real estate, adjust volatilities are almost identical. Furthermore, rather than private real estate being uncorrelated to equity markets, adjusted returns show that private real estate portfolios tend to be just as correlated to equity markets in markets where listed real estate investing is mature (e.g., the Netherlands) and less correlated to listed equity than private real estate itself in markets where listed real estate investing is less common(e.g., the U.K.)!
Lastly, the cost of investing in private markets cannot be ignored. Differences in investment performance within an asset class depend on a multitude of factors – geography, sectors, currencies – but costs are always subtracted off the top. In private equity, costs can exceed 5% of net assets whereas indexed listed equity is effectively free. For real estate the same is true if less extreme; most private real estate portfolios are core, which costs around 1% of net assets. However, for more expensive styles it’s not uncommon for private real estate costs to exceed 2-3%, far higher than for active listed real estate which typically sits at 0.30% of net assets.
The allocations, returns, costs and other quantitative data on institutional investor portfolios provides rich ground to support common knowledge, but also to debunk certain myths. Yes, private equity has had a good run of returns, especially during 2019-2021, but the volatilities are high too, resulting in similar Sharpe ratios across equity implementation styles. But no, listed real estate is not more volatile than unlisted real estate, and correlations to other asset classes are broadly similar as well, showing that the two channels of investing offer exposure to the same underlying asset class, namely real estate.
† In the U.K. data is only available 2008 – 2021.
‡ CEM Benchmarking does not currently have a model to address the potential reporting biases in private fixed income.
[1] One notable exception is Sweden, where private real estate has produced very strong returns, especially in 2019 and 2021.
