European Listed Real Estate - not too big, not too small, where is the outperformance?
By Giovanni Curatolo, Research and Indexes Analyst
One useful metric that can be used to gauge whether a market is favourable or not for active management is the market breadth, that is, the share of index constituents that outperform the index over a given period. Looking back over the past decade, there appears to be a strong negative correlation (-0.71) between the FTSE EPRA Nareit Developed Europe Index’s quarterly total return and its breadth, meaning that when the index delivered strong returns, fewer stocks managed to beat it, and vice versa.
One plausible explanation for this negative correlation lies in the index methodology, being a market cap-weighted index, it is heavily concentrated in its largest constituents. Over the past ten years, the combined weight of the 30 largest companies in the index averaged 72% of the total free-float market capitalization. With an average of 104 constituents over the same period, this means that the benchmark’s overall performance has predominantly been driven by ca. 29% of its constituents. For comparison, as of August 2025, the largest 30 stocks in the FTSE Developed Europe All Cap Index accounted for 37% of the total weight, hence almost half the “concentration” observed within the FTSE EPRA Nareit Developed Europe Index. Logically, this implies that when the sector’s “large caps” perform poorly, the entire benchmark is likely to follow suit.
But what about the companies that sit at the core of the benchmark, right after the largest 30?
The chart below shows the performance of an equally weighted portfolio built out of 50 companies ranked 31-80, i.e., those constituents immediately after the top 30 mentioned above, against the FTSE EPRA Nareit Developed Europe total return Index. Over the past ten years, the former clearly outperformed the latter, returning almost 7 times more.
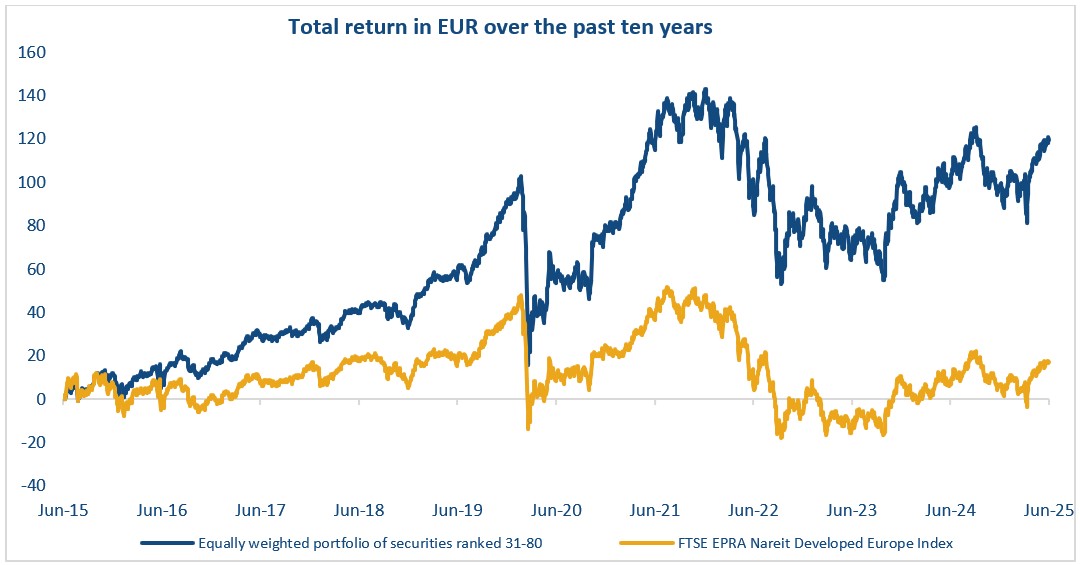
This shows that although larger constituents tend to benefit from being more liquid and having easier access to capital markets, smaller companies may offer meaningful alpha opportunities that might be overlooked precisely due to their smaller size and lower visibility.
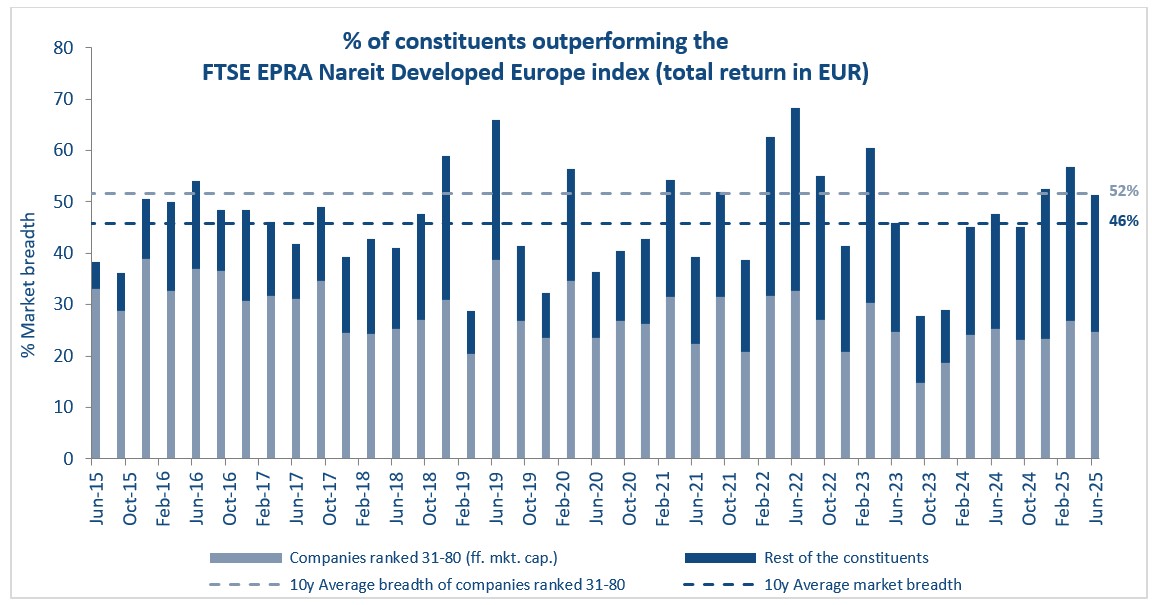
Looking at the full benchmark data from the past decade, we find that in more than a third of all quarters, over 50% of the constituents outperformed the index, and in 38 out of 41 quarters, over 30% managed to do so. But what about that group of constituents sitting in the middle of the benchmark? Well, on average, 60% of the constituents outperforming the FTSE EPRA Nareit Developed Europe Index over the past ten years were ranked 31-80. Over the same period, the average market breadth of this smaller group was 52%, meaning that more than half of the companies that sit in the middle of the benchmark managed to outperform the index on a quarterly basis over the past decade.
Recent quarterly data shows that the share of companies outperforming the European index (market breadth) sat at 51% as of June 2025. In the first quarter of 2025, this figure was even higher at 57%, and both are well above the long-term average of 46% per quarter, as the chart below illustrates. This underlines more favourable market conditions for active managers, who may be able to scoop additional alpha by looking past the most dominant names in the index.